So the election was almost a week ago. Here's how our little experiment turned out.
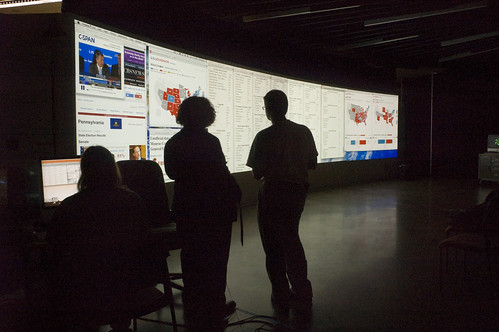
The evening started out rather slowly, with information trickling in about races that were all but confirmed. We had the Innovation Center's display set up with various maps and information, and my page in the center in five columns, all showing zero votes. We waited until the polls closed at 9PM, and then we waited some more for the information to travel to the Board of Elections and make it onto the XML file. Even at this point, I still didn't know if the scraper was going to work, so I was checking the official unofficial results page to make sure they didn't have anything we didn't.
When the first results popped on the screen, it was amazing. When results kept pouring in, it was even more impressive. When we finally figured out that all those numbers were wrong, it was time to start getting things fixed.
There were several differences from what the Canadian data had led me to expect, and so I spent most of the night fixing small problems as they showed up. First, votes in NYS are tallied by party, even if multiple parties are running the same candidate. This was quite different from what I had been led to expect, and so the numbers we started out with were quite.. bizarre. Before we realized what was going on, it looked like Paladino was beating Cuomo in Monroe County almost 4 to 1. Checking back with the flash page revealed that I was only counting one party for each candidate, and whichever came last would show up on the screen. I had to keep a running count for each candidate rather than throwing out old data when going through the file.
Having fixed that, and seeing that the numbers now matched what was coming out of the flash page, I settled back down and watched the third parties fight for 50,000 votes. That is, until someone pointed out to me that Andrew Cuomo was currently listed with 1.7 million votes for Monroe County alone. Seeing as how the total population of the area is only about 1 million, there was clearly something wrong. It seems that in my haste to keep count of how many votes a candidate got from each party, I was not clearing these numbers once the file was done being read. This was probably the hardest fix I had to make during the night, as it broke some of the models I had naively put forth on how the program should run.
I eventually ended up with a workable solution, though I was sad to see the third party numbers were much lower now. There remained only one small problem, being that most vote totals seemed to be exactly twice what the flash site claimed they were. Finally, I realized that there was a master 'total votes' line for each candidate which made most of the hacks and shims I had written into my scraper obsolete. Instead, I could simply show only this total line and everything would be right again.
This was an amazing experience, especially how the work I was doing was being picked up by people outside of RIT. Having to think fast on my feet was a new one too. I, like most programmers, usually like to examine a problem in detail and have time to test theories before publishing changes. Here, I was coding just about as fast as I could to fix each bug that turned up, and we managed to make it work before the last precincts rolled in.
But even more than that, this was an opportunity to take the skills and tools I've been accumulating through my time at RIT and make them do something more than just a class assignment. This wasn't just another program to be written and forgotten, this was something that represented the school to some of the public who perhaps hadn't heard about what we're doing here. And that is cool.